


GOOGLE SHOPPING INSIGHTS
Research, Design system, User interface design, User experience, Product design, 2017-2018
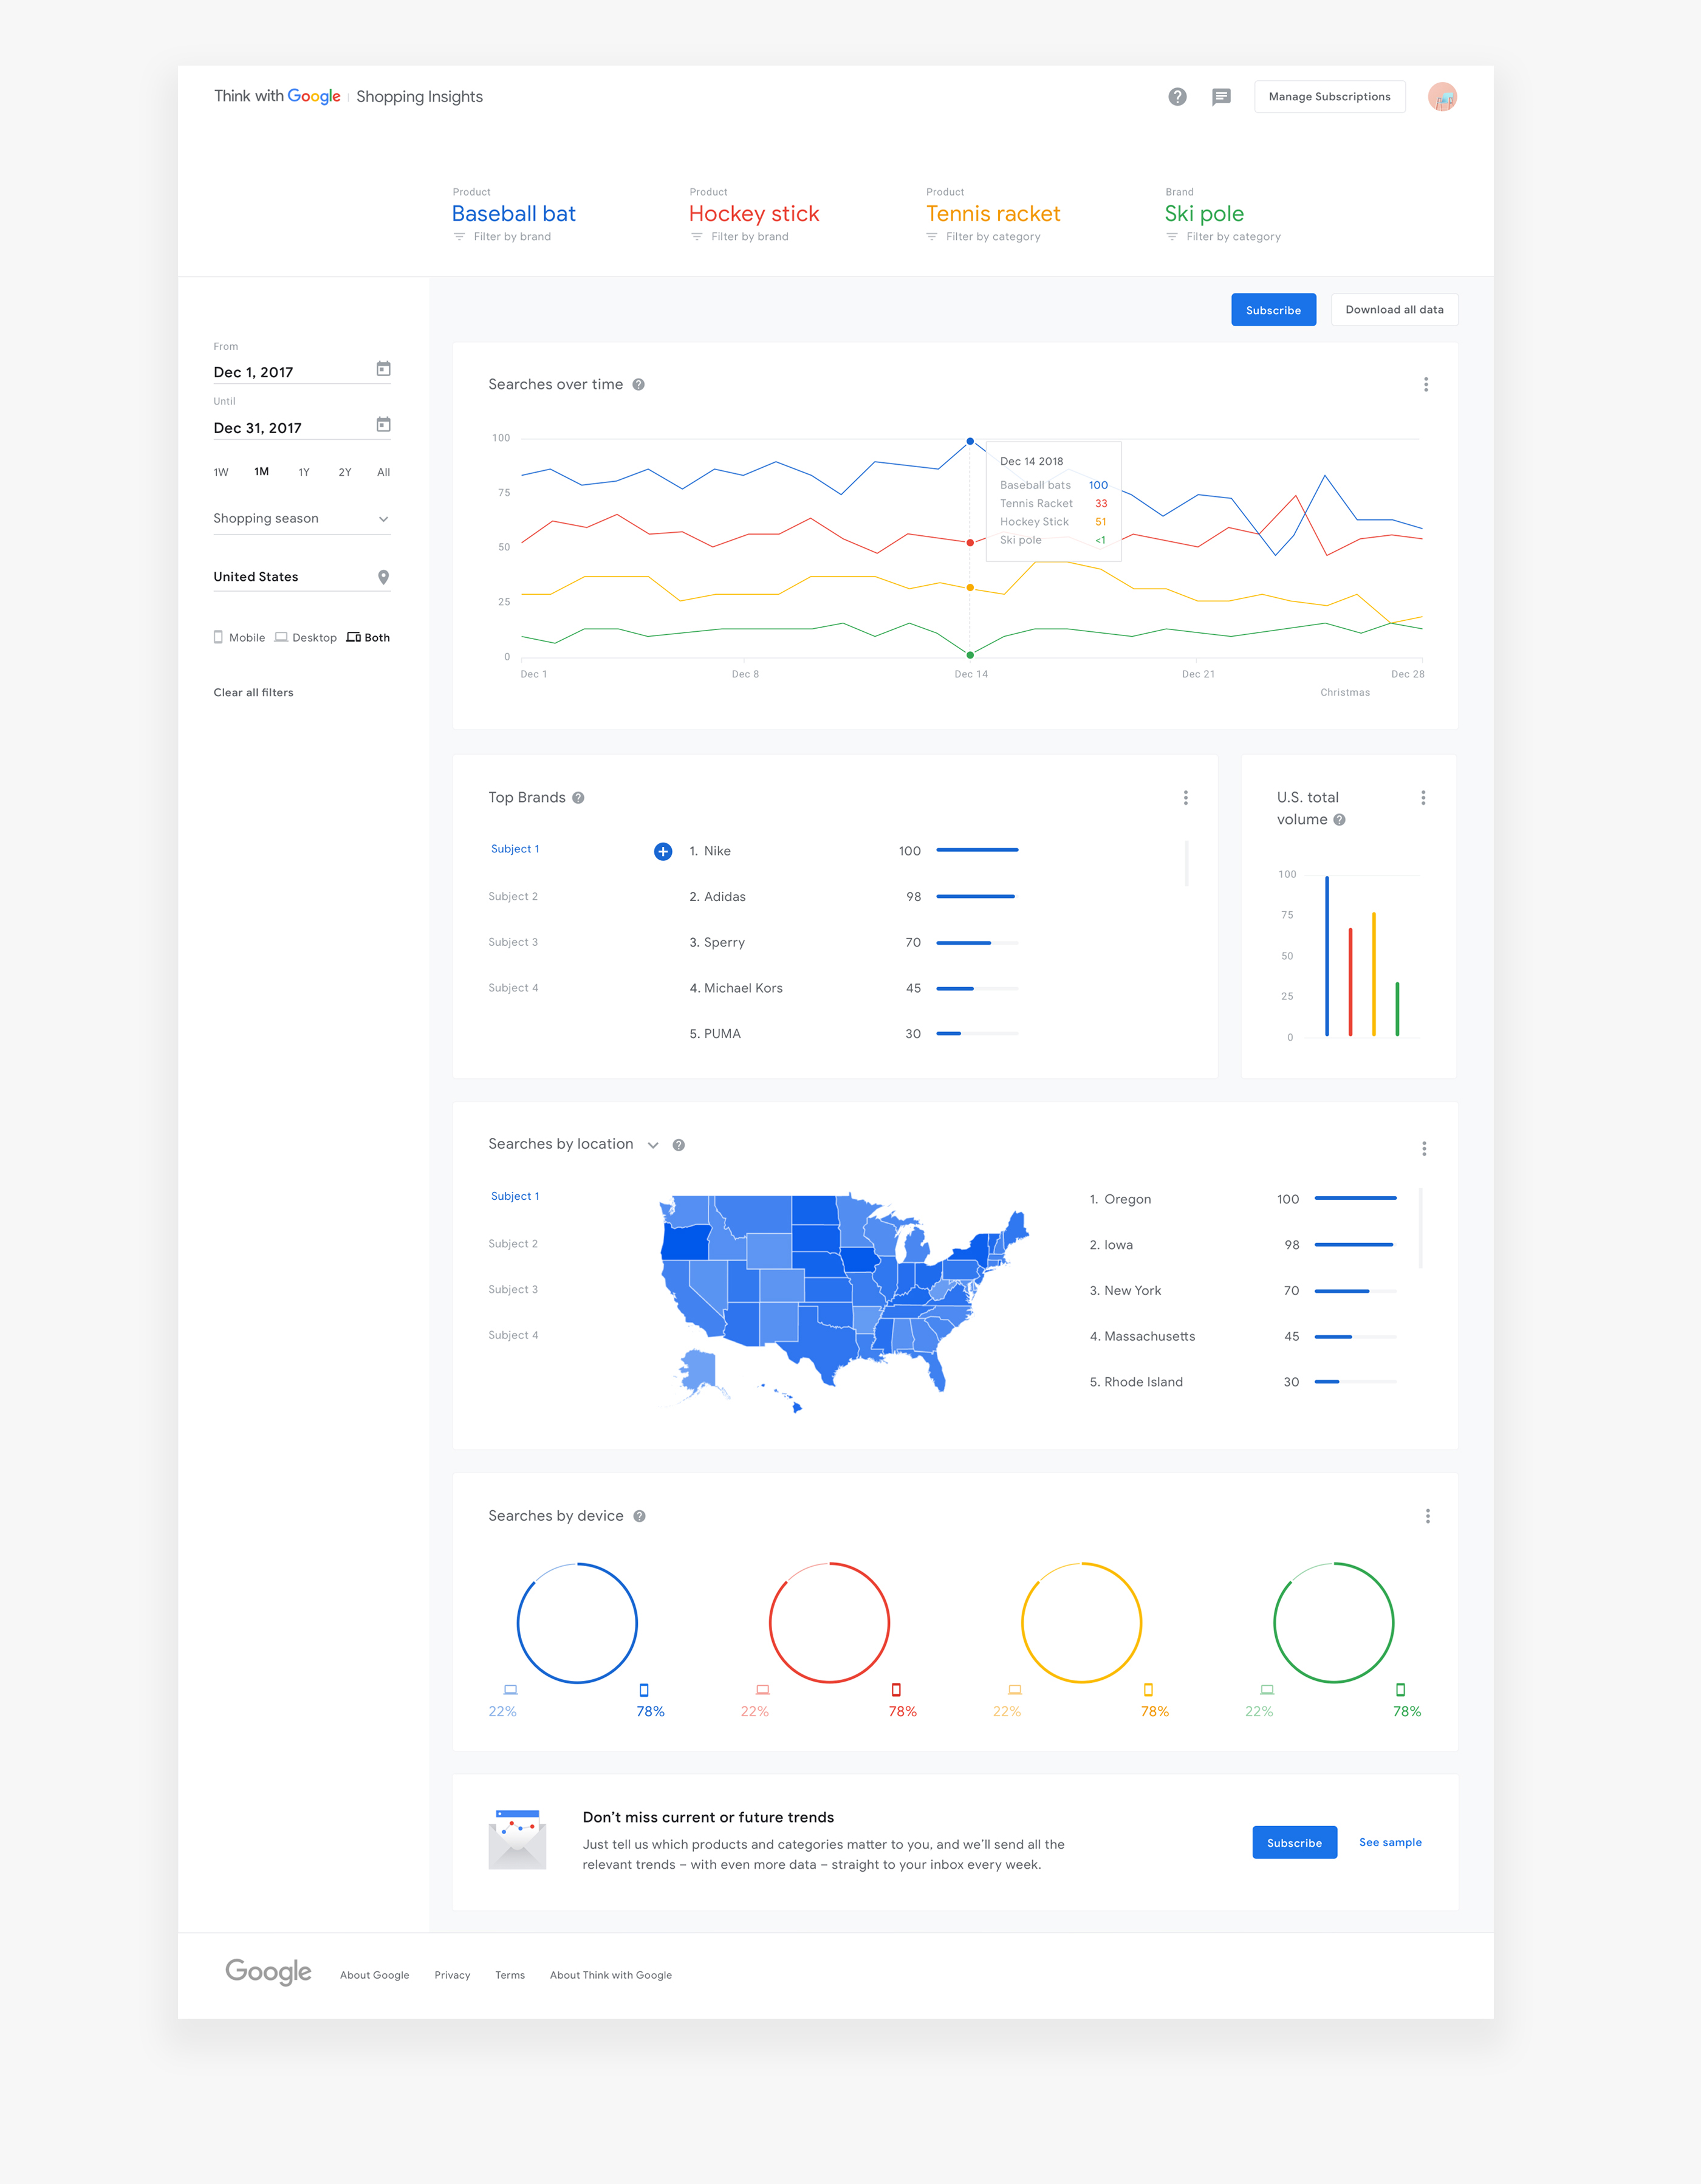
Shopping Insights is a measurement tool that analyzes keyword data, such as products, categories, and brands, from all relevant searches. It helps marketers and retailers understand what shoppers are looking for, compare competing products in their categories, discover local demand for their brands and products. Our goal for this project was to help marketers and retailers make more informed decisions about their marketing through the type of data and insights that Google can provide.
To deliver the readability of compound data sources we had to come up with simple solutions to complex problems. The Shopping Insights design system that I developed was born from the deep clarity that comes from knowing the essence of the product and understanding the engineering and function of every single component. The whole process was a great opportunity to learn more about Google's Brand Standards, Material Design, and Data Visualizations. A pivotal moment for me came when I understood Google to be a cultural institution as much as it is a tech company.
Shopping Insights key features:
Daily search data
Get a deeper understanding of shopping trends with daily search data for 55K+ products, 45K+ brands, and nearly 5K categories, across all 210 Designated Market Areas (DMAs) in the U.S.
Category-specific search comparison
Compare the popularity of different products and brands within your category
Personalized reports
Get personalized reports via email with weekly and monthly trends for categories and products important to your business
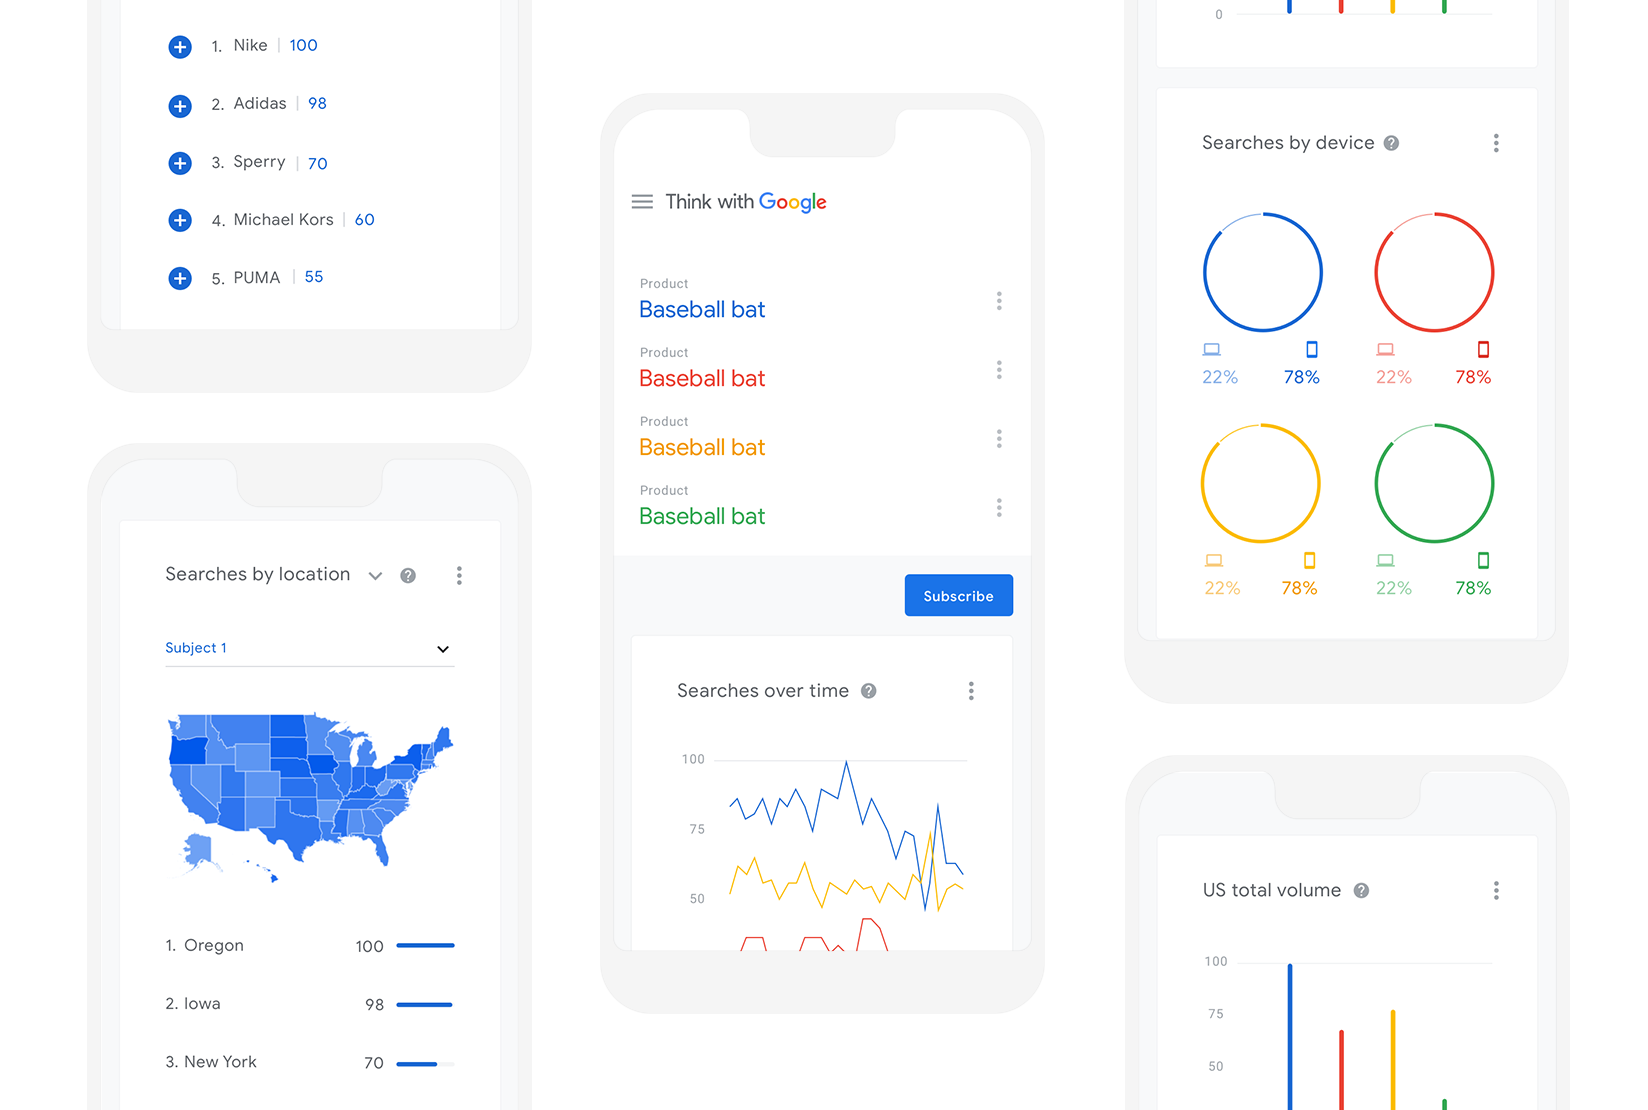
Device search comparison
See share of mobile and desktop searches to plan your strategy for each screen
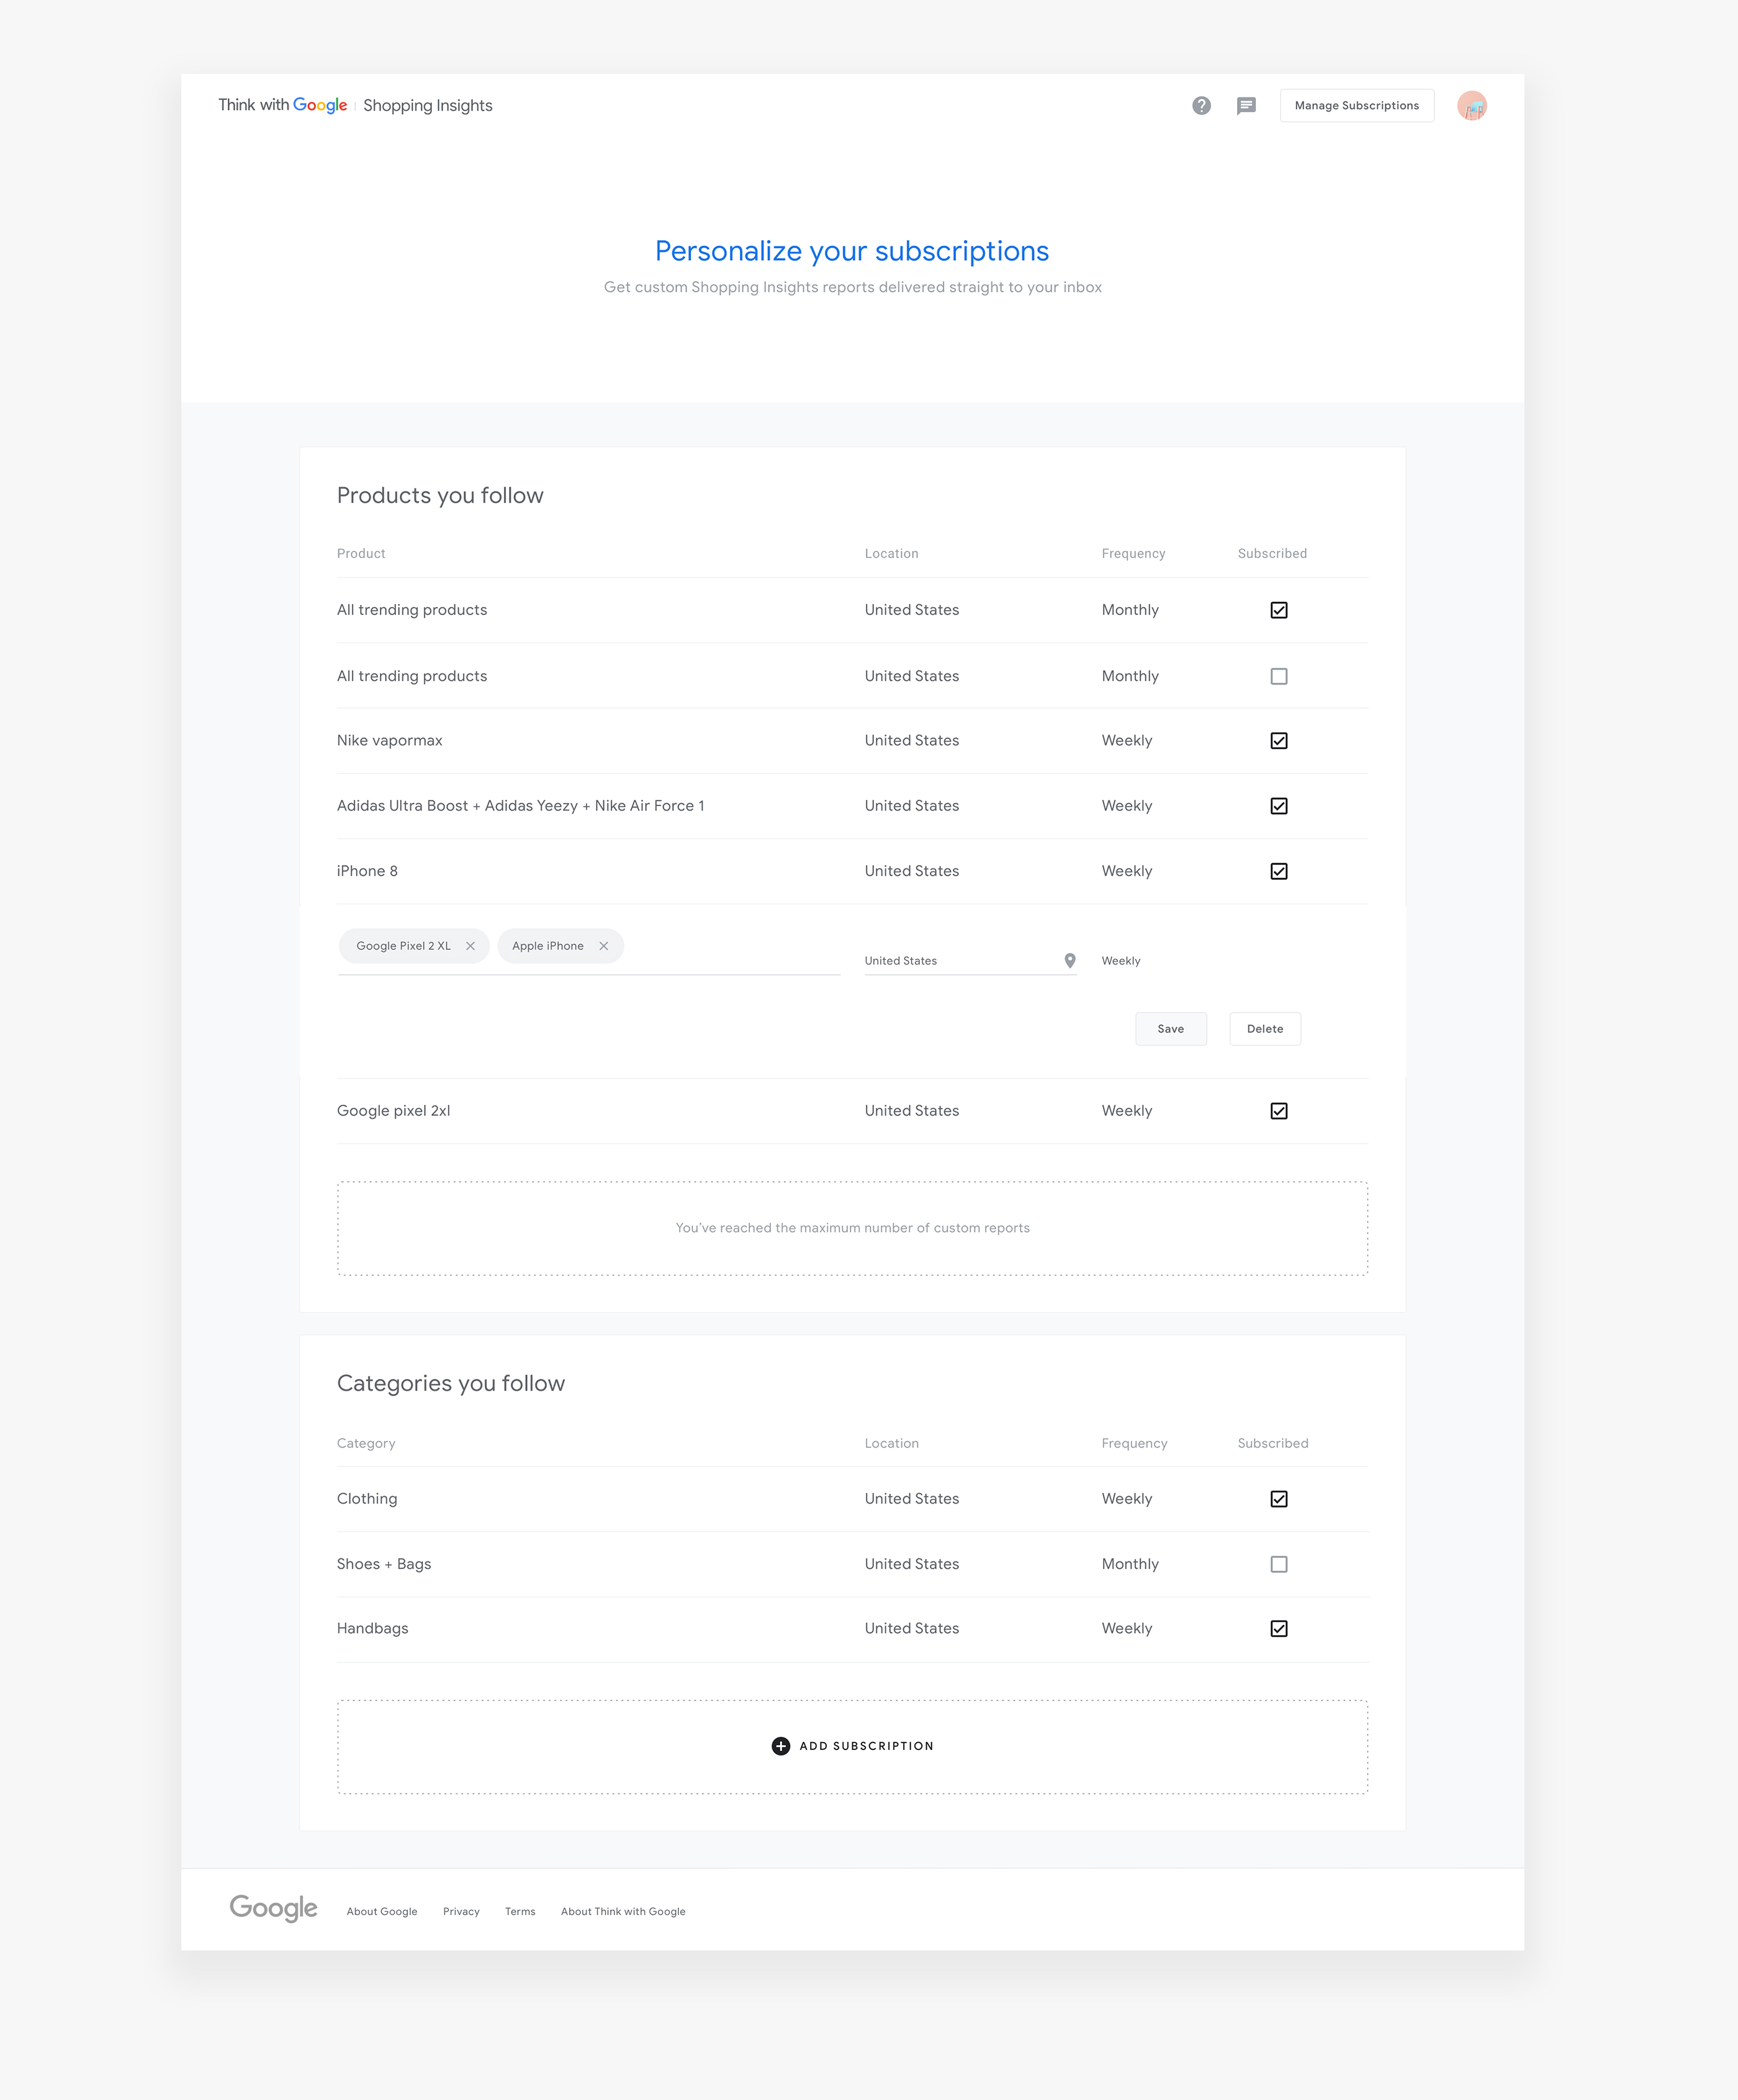
The below sitemap addresses the structure of Shopping Insights: Homepage, Explore data, Manage subscriptions, FAQs, and About us. Majority of traffic is currently coming from email subscription and email reports. Subscription component is triggered by a user's query that generates a potential personalized eco system within the product.
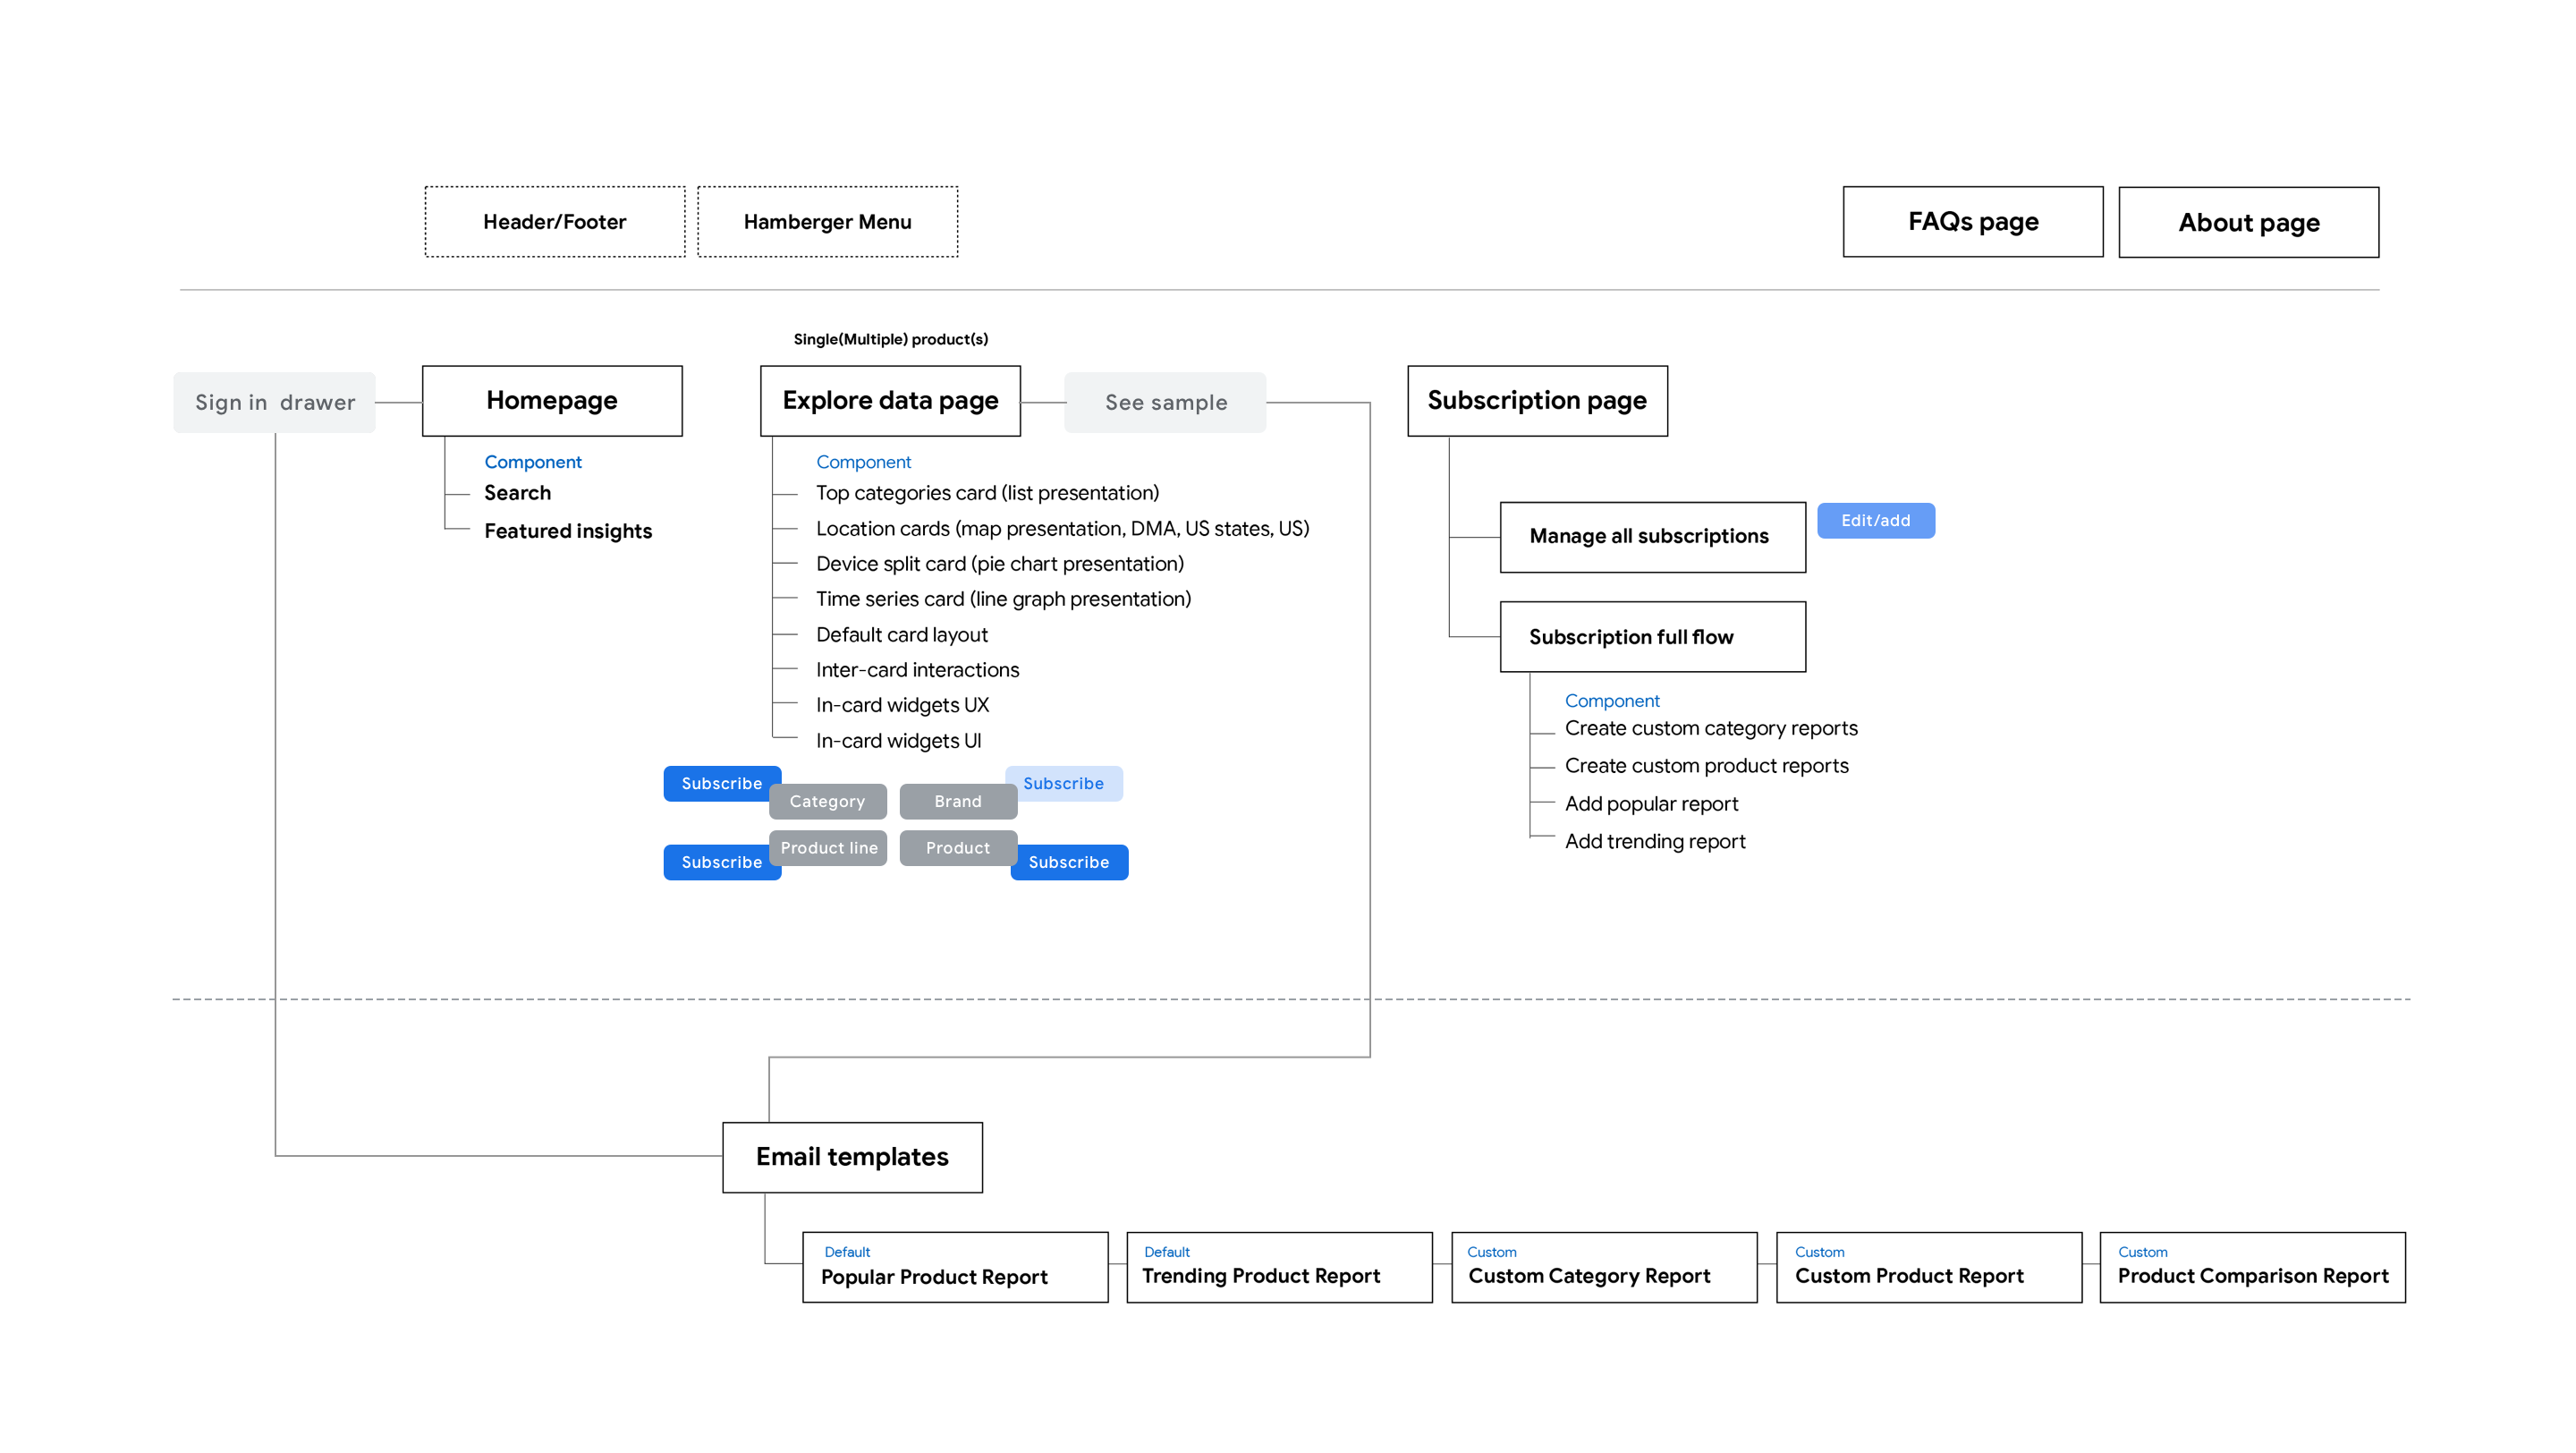
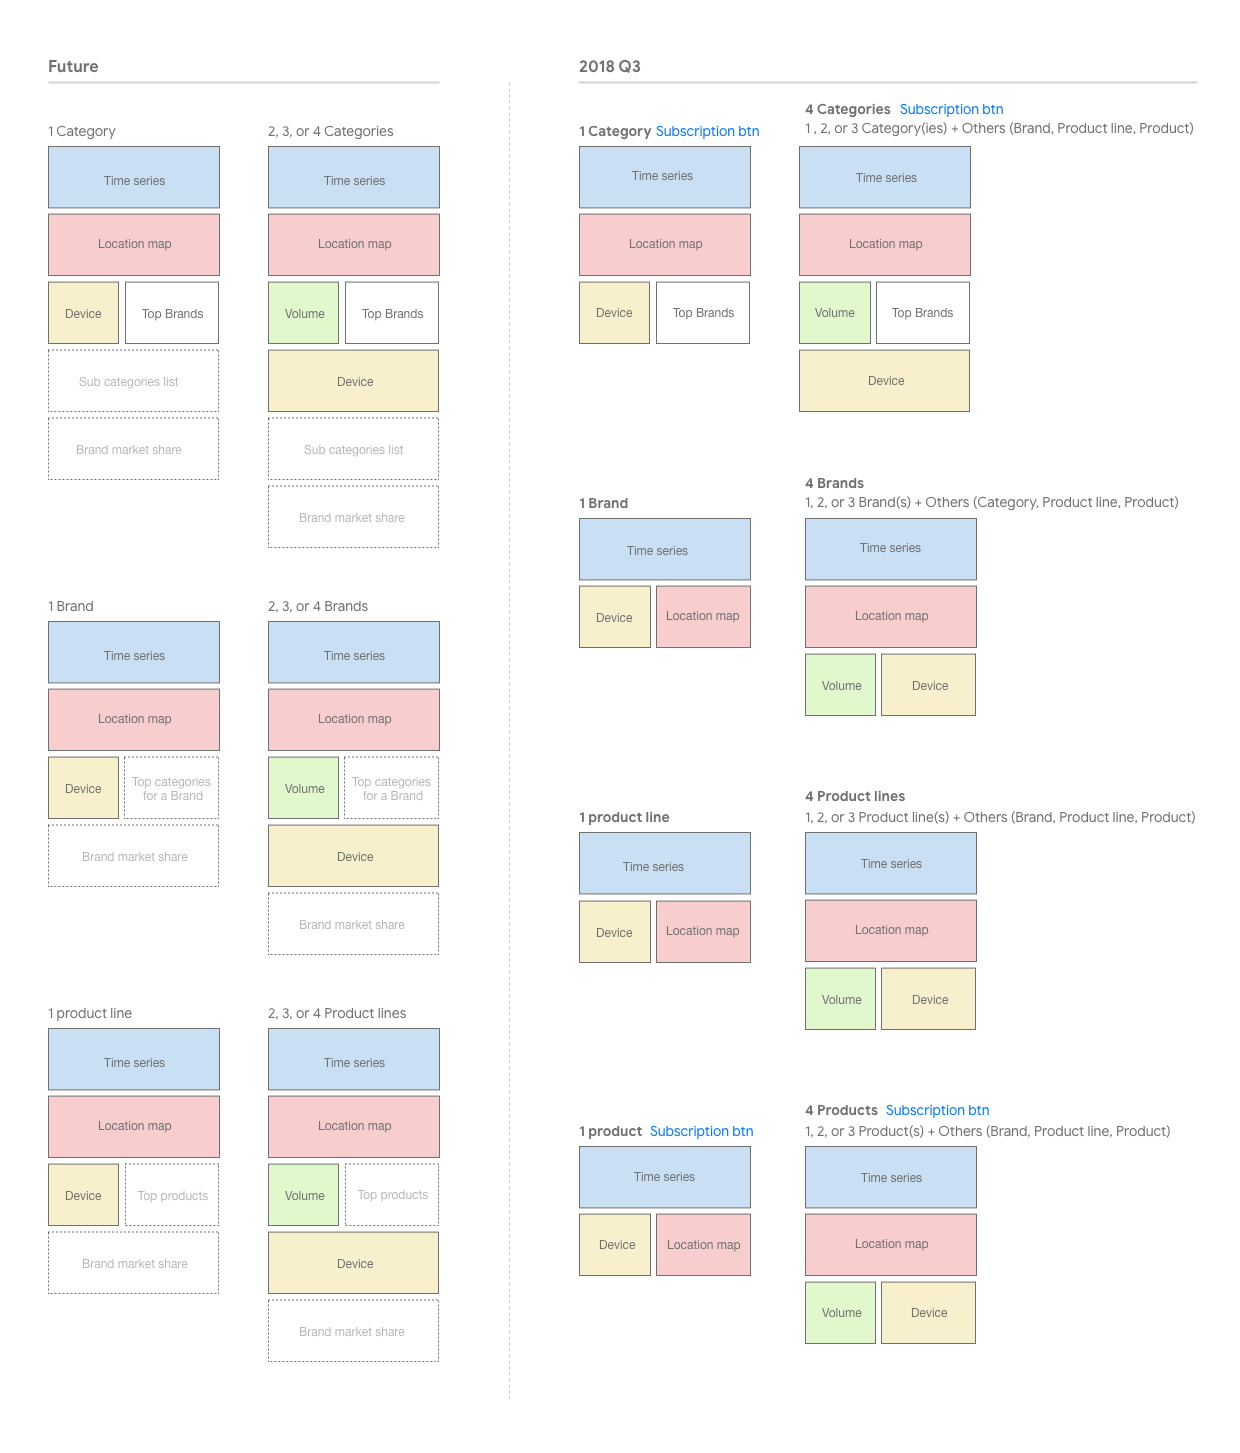
The map below explains how each page is built with a collection of cards based on a user's query. The user can compare a maximum of four entities. The number of categories, brands, product lines, or products determines the combination of cards with a specific layout. When the user searches for only one subject, the Volume card is not presented because it is a comparative card; the total relative search volume represents the popularity of subjects compared to each other. Otherwise the volume card is always displayed. The Brand card is displayed when a user searches for a category or a brand filtered by a category. For instance, Bose filtered by headphones would show the rank of headphones in the Brand card.
Team credit —
Copy: Marianna Nash UX: Monica Mueller, Shridhar Reddy Mula Eng: Justin Maurer, Mathias Paumgarten, Faustine Pollet, Flannan Brody Data: Paul Horn, William Chang PM: Christina Opsasnick, Alpa Narwariya
NEXT PROJECT